The Business Case for Project Development Software: What It Costs Not to Invest
Software budgets are approved in business language, not IT language. The five questions every investment must answer — and a worked business case for project development software, with illustrative numbers a CFO can interrogate.

One of the hardest conversations for anyone leading technology in an energy development organization is not deciding what to implement.
It is explaining why the business should invest in it.
The conversation often fails before it starts, because the request is presented in IT language: licenses, modules, hosting, integrations, support.
Leadership is thinking about something else entirely: risk, continuity, productivity, growth, cost.
If you are the person who has to defend a software line item in front of a CFO or an investment committee, this article is the argument — with numbers you can interrogate.
Software Is Not an IT Expense. It Is an Operating Decision.
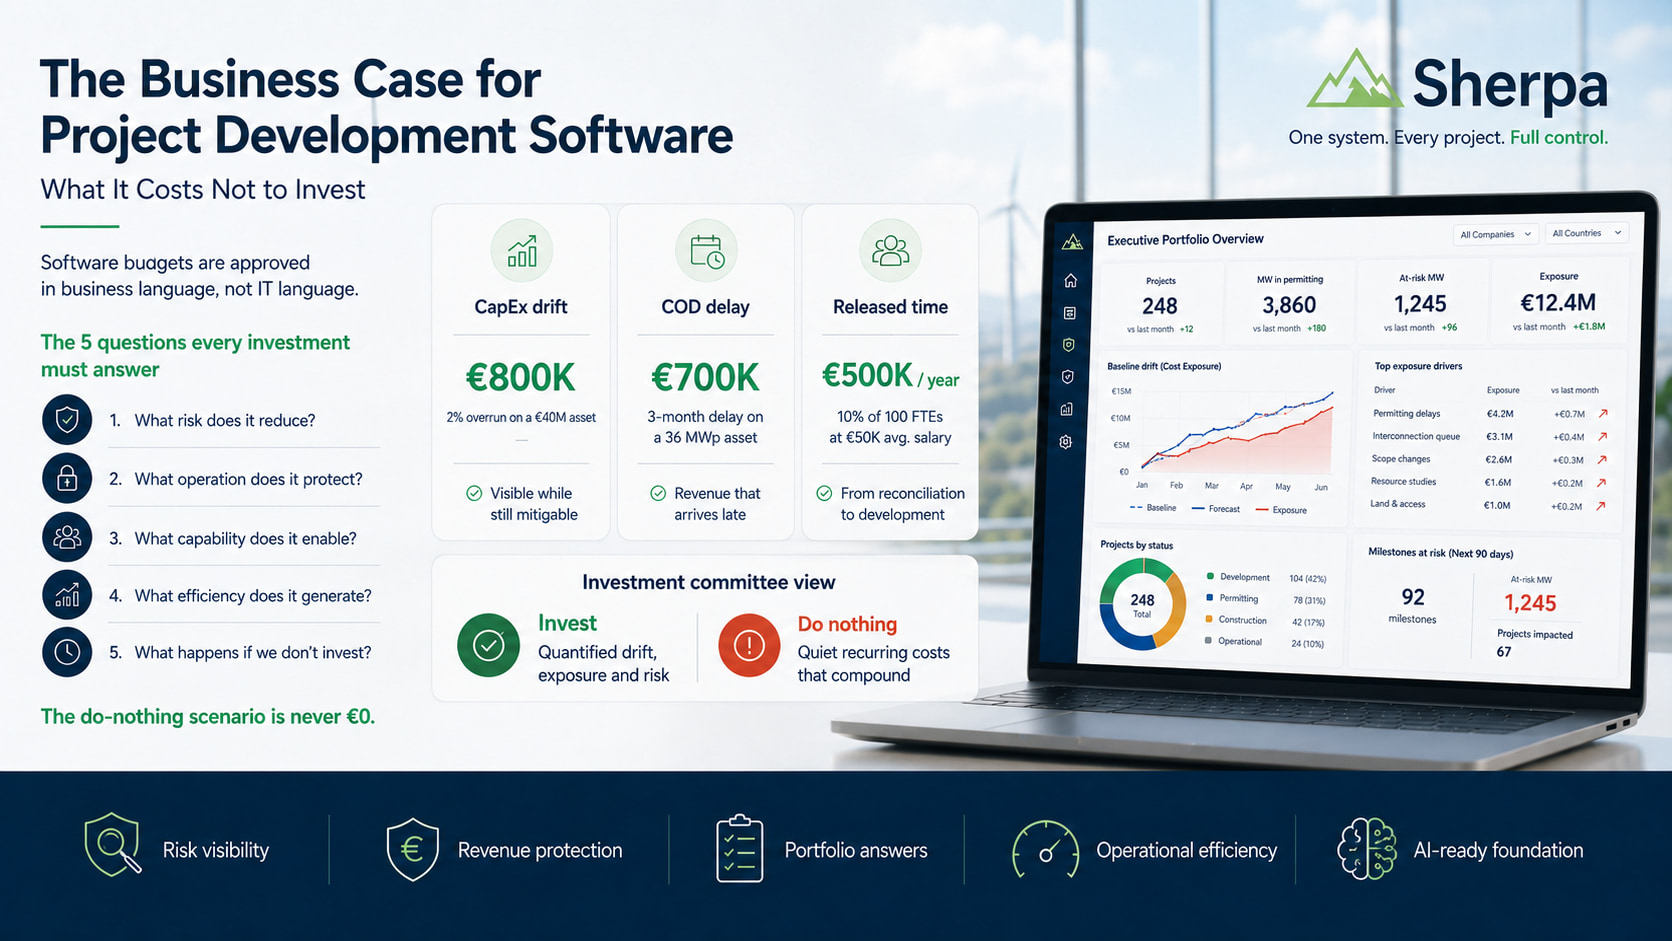
A software budget should not be a list of costs. It should be a business case that answers at least one of five questions:
- What risk does it reduce?
- What operation does it protect?
- What capability does it enable?
- What efficiency does it generate?
- What happens if we decide not to invest?
The last question is the one that decides budgets — and it is the one most software conversations never reach.
So let's take them one at a time, for the specific case of energy project development software.
What Risk Does It Reduce?
Energy development portfolios lose money quietly, through drift that nobody sees until it is consolidated.
Consider CapEx.
A 2% negative deviation sounds like a rounding error. On a €40M CapEx asset, it is an €800,000 overrun.
Deviations of that size rarely announce themselves. They accumulate through small changes — a redesigned access road, a delayed component order, a contractor claim — each individually absorbable, none visible as a pattern.
A platform with preserved baselines and a quantified risk register does not make the deviations disappear. It makes them visible while they are still mitigable — when the conversation is "how do we contain this?" rather than "how did this happen?"
What Operation Does It Protect?
The operation being protected is the revenue timeline.
A permit issue or a land securement gap discovered late does not stay administrative. It propagates to Ready-to-Build, to Notice-to-Proceed, and finally to COD — the date the asset starts selling energy.
Put a number on it.
A 36 MWp asset producing 70 GWh per year loses roughly 17.5 GWh to a three-month delay. At €40/MWh, that is about €700,000 of revenue that does not arrive when the financial model said it would.
Delays are not operational footnotes. They are financial events.
The Cost of Delay: why energy development needs economic visibility →
What Capability Does It Enable?
There is a question every leadership team asks: "How many MW are in permitting right now?"
In a fragmented operating model, answering it takes three people and two days — and the answer arrives as a spreadsheet nobody fully trusts.
The capability a governed platform enables is not a prettier report. It is that every level of the organization can get its own answer from the same source:
- The development director sees which projects drifted from the committed baseline, and when the drift started.
- The COO sees where execution is blocked and which teams need help.
- The investment director sees exposure in MW and euros, sorted by financial relevance.
- The board sees a portfolio position that matches what the country teams are actually working in.
And there is a second-order capability: AI. Agents and assistants are only as good as the data they reason over. A governed operational model is what makes them usable at all.
IPP portfolio management software — the portfolio governance guide →
What Efficiency Does It Generate?
The efficiency case is usually presented last, but it is the easiest to estimate.
Suppose the platform releases around 10% of the time of the people managing permits, land securement and construction — the hours currently spent reconciling spreadsheets, chasing status by email and rebuilding reports.
For an organization with 100 FTEs in those functions at a €50,000 average salary, that is roughly €500,000 per year of released time.
The point is not headcount reduction. It is redeploying expensive domain expertise from reconciliation to development — the tasks that actually move projects toward COD.
The Cost of Not Investing Is Paid Quietly
Here is the uncomfortable part: the do-nothing scenario is never €0.
Its costs simply never appear on an invoice:
- Management spends time validating definitions instead of making decisions.
- Schedule deviations surface at the quarterly review — after they are baked into COD.
- The same KPI is calculated differently by different teams, so every number triggers a debate.
- Due diligence slows down because nobody fully trusts the portfolio snapshot.
- When an experienced team member leaves, the institutional knowledge leaves with them.
None of these line items get budgeted. All of them get paid — and the three figures above (€800,000, €700,000, €500,000) are what a single year of paying them can look like on a mid-size portfolio.
Two Scenarios for the Investment Committee
A budget conversation changes when technology stops presenting requests and starts presenting scenarios.
Scenario A — invest. A purpose-built platform, live in 4–8 weeks, starting with one workflow. Drift, exposure and risk become quantified numbers the investment committee can weigh. Residual risk is explicit.
Scenario B — don't, or invest minimally. The visible cost is €0. The real cost is the quiet list above, recurring every year and compounding as the portfolio grows.
Presented this way, the budget stops being a negotiation between technology and finance. It becomes a business decision about priorities, risk and value.
And the realistic menu usually has four options, not two:
- Do nothing — keep the spreadsheets. Genuinely viable for a handful of projects with simple land situations; increasingly expensive past that.
- Harden Excel — more discipline, more templates. It improves hygiene, but a spreadsheet cannot preserve baselines, quantify risk or govern definitions.
- Build bespoke — one leading European developer did exactly this, successfully. It took a multi-year business-discovery effort before the software could even be specified.
- Buy purpose-built — the operating model of energy development, already codified, configured to your portfolio in weeks.
How a €10B+ portfolio moved through these stages — the full case study →
A Note on These Numbers
Every figure in this article is an illustrative assumption, drawn from the worked examples we use in real commercial proposals — a €40M CapEx asset, a 36 MWp project at 70 GWh/year and €40/MWh, 100 FTEs at a €50,000 average salary.
It is worth being explicit about where those sit against public benchmarks, because a business case that quietly assumes the best of everything is the kind an investment committee is right to distrust. The €40M on 36 MWp implies roughly €1.1M per MWp, above the USD 779/kW that IRENA reports as the 2024 European average total installed cost for utility-scale solar — our figure carries development, land and grid-connection costs that a plant-level benchmark does not. The 70 GWh implies about 1,944 kWh/kWp, which is at the top of the European range and assumes a strong southern-Spanish resource with tracking. And €40/MWh sits above the roughly €34/MWh that Spanish solar actually captured in 2025, as PV build-out pushes capture rates down.
None of that weakens the argument, because the argument is structural rather than arithmetic: a delay costs you the revenue your own model says it costs, whatever your own numbers are. But substitute a lower capture price and the delay case gets smaller while the CapEx-drift case gets proportionally larger — which is itself worth knowing before you present it.
Your portfolio will produce different numbers. That is exactly the point: substitute your own assumptions, and the structure of the case holds.
A directional estimate is often dramatically more useful than no estimate at all.
Sources
- IRENA — Renewable Power Generation Costs in 2024 (summary) — utility-scale solar total installed cost, USD 779/kW European average in 2024 — the benchmark the €40M / 36 MWp CapEx assumption sits above
- OMIE — Spanish day-ahead electricity market results — day-ahead prices behind the €40/MWh capture assumption; Spanish solar captured closer to €34/MWh in 2025
- PVGIS — European Commission Photovoltaic Geographical Information System — specific-yield reference for the 70 GWh from 36 MWp assumption (~1,944 kWh/kWp)
- Eurostat — hourly labour costs — context for the €50,000 average salary used in the released-time calculation
Nobody approves a budget because the ROI model is precise. They approve it because the consequences of not investing are finally visible.
Because in the end, justifying an investment in project development software is not about explaining what the technology costs.
It is about explaining what it costs the business not to have it when it is really needed.
Renewable energy project development software — the buyer's guide →