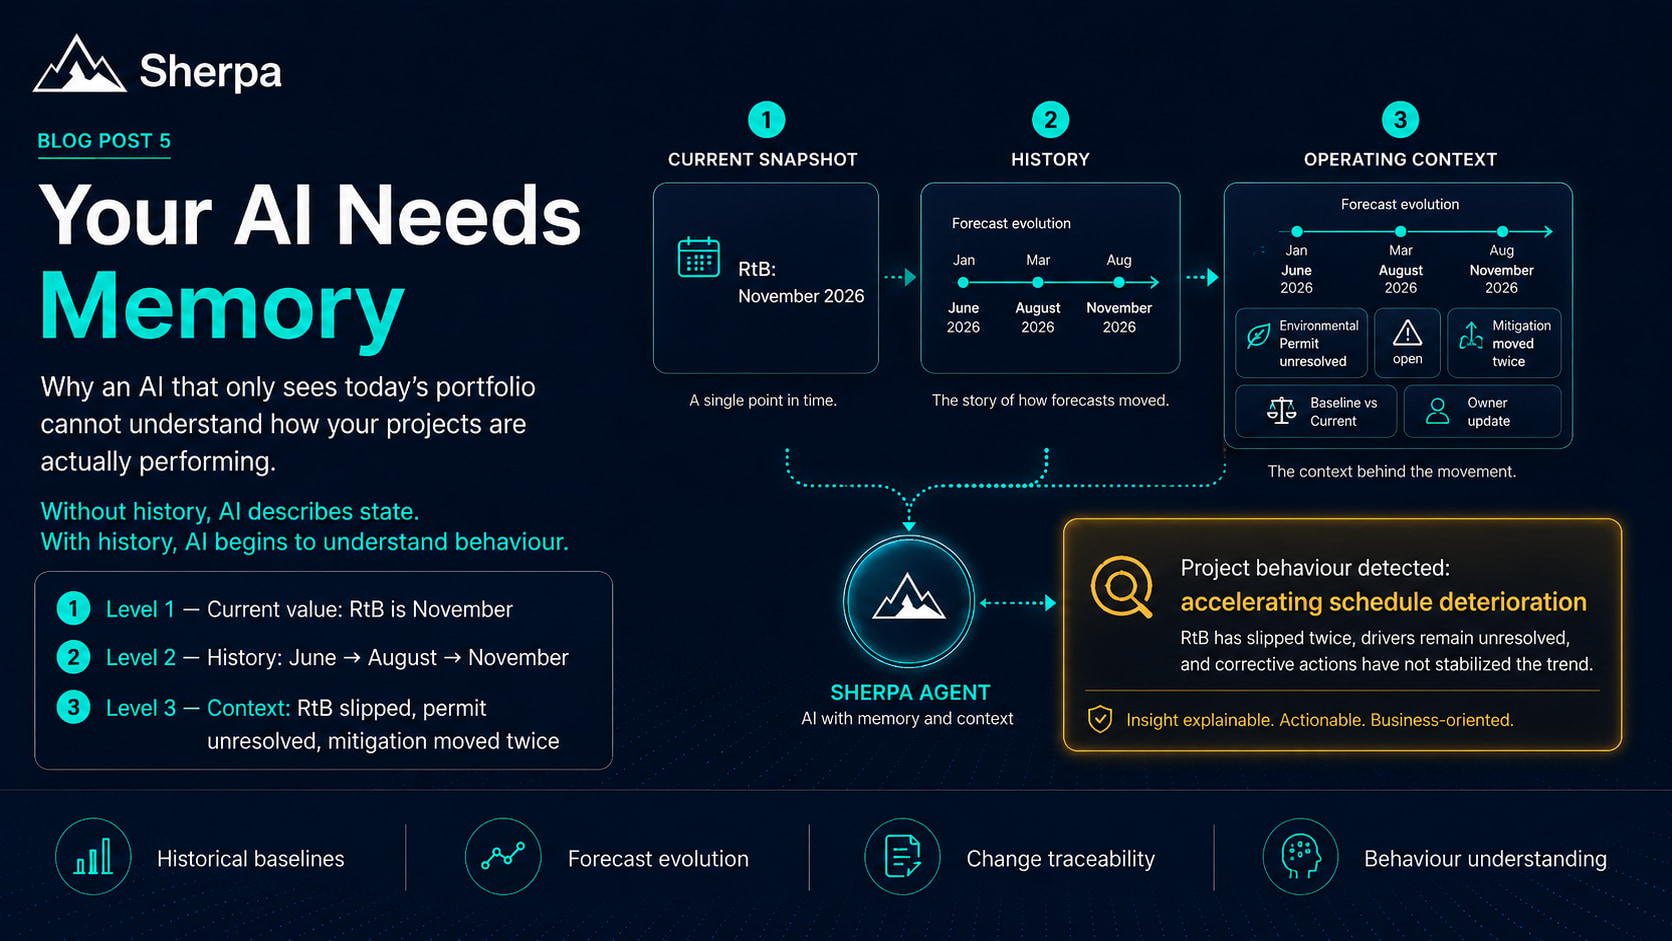
AI Should Find the Next Delay Before the Dashboard Turns Red
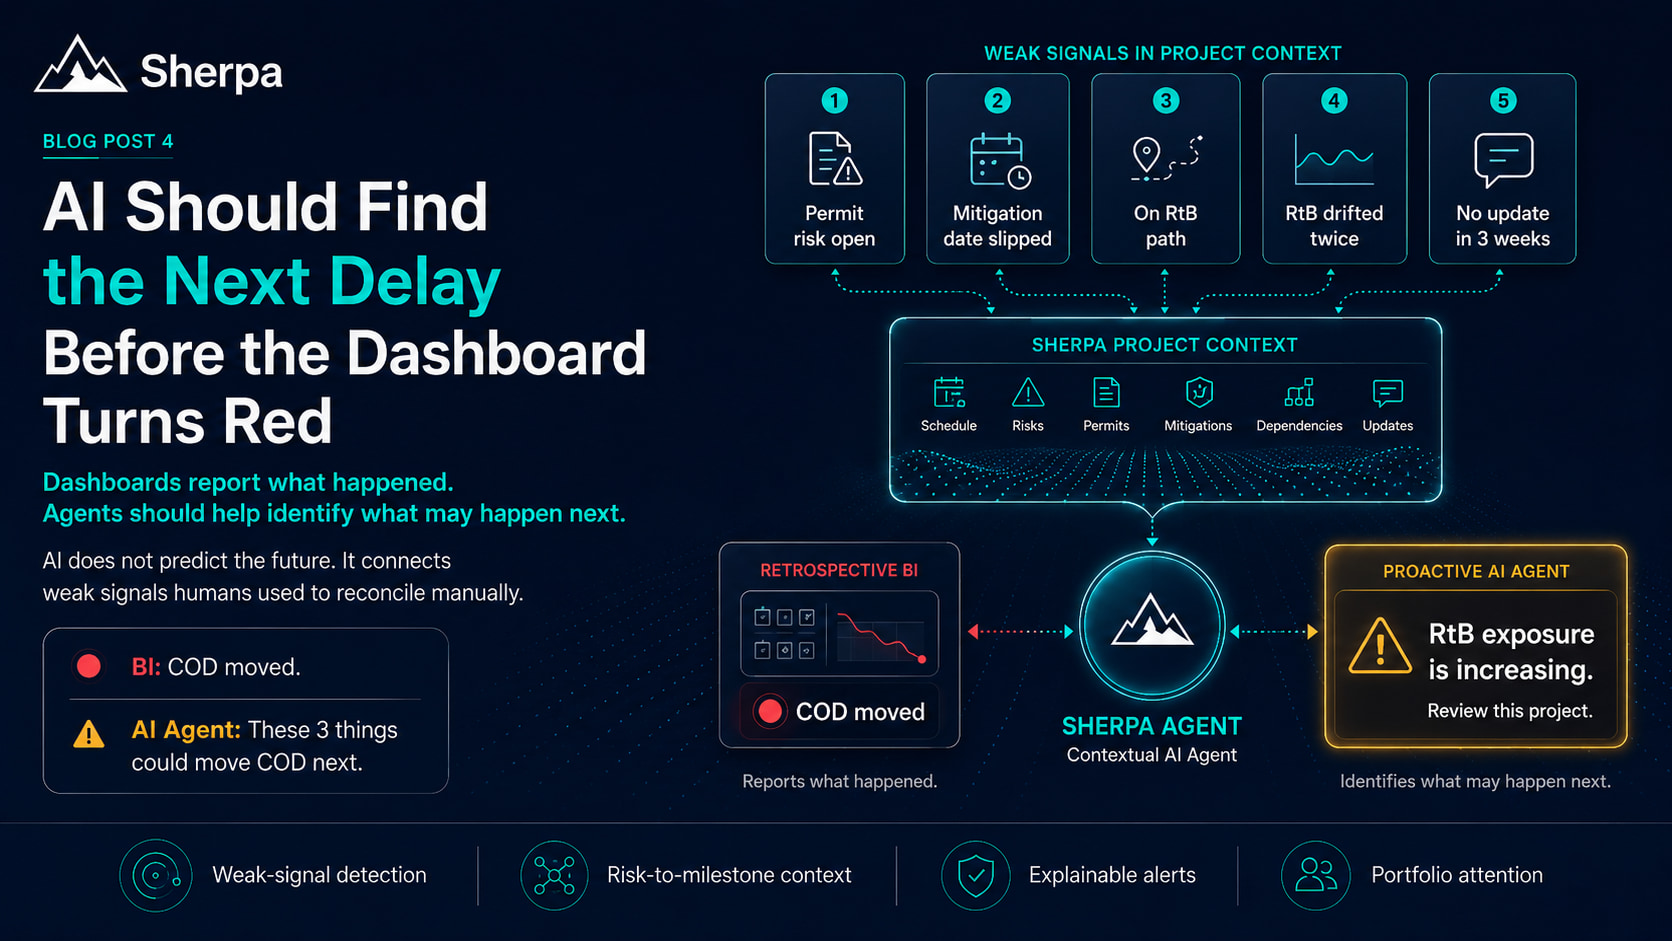
BI reports that Project X is delayed — useful, and late. The interesting question is what happened in the weeks before the box turned red: the open permit risk, the mitigation that slipped again, the RtB that already drifted twice, the three silent weeks. AI should connect those signals while there is still time to act.
 Luis Cabello4 min read
A red dashboard is useful.
But it is also late.
By the time a portfolio dashboard says:
Project X is delayed.
the delay already exists. The milestone moved. The variance is measurable. Management can now see the problem.
That is good reporting.
But what happened in the weeks before the box turned red?
That is where AI starts becoming interesting.
Dashboards report what happened. Agents should help identify what may happen next.
Delays Rarely Appear All at Once
Imagine a project that still looks broadly on track. Then, quietly:
- An environmental permit risk remains open.
- Its mitigation action was supposed to close two weeks ago. That date moves again.
- The permit sits directly on the RtB path.
- RtB itself has already slipped twice this year.
- And nobody has updated the risk commentary for three weeks.
None of those signals means the project will be delayed. AI should not pretend to predict that.
But taken together, they mean something important:
Exposure is increasing. Someone should look at this.
That is a much more credible role for operational AI. Not predicting the future — connecting weak signals before humans have to reconcile them manually.
Same Date. Different Trajectory.
Consider two projects. Both show RtB in December.
On a dashboard, they look identical.
Project A has not moved in eight months. Its critical permits are on schedule. No major risks remain open. The land position is secured.
Project B started the year at June. Then August. Then October. Now December. An environmental permit remains unresolved, its mitigation commitment has moved twice, and the workstream has not been updated recently.
Same current RtB.
Completely different trajectory.
A snapshot cannot tell them apart. Early warning is a context problem: state, history, risks, dependencies and ownership — connected.
RAG is not enough — why AI needs an operating model →
From System of Record to System of Attention
Traditional BI is extremely good at describing state: what is delayed, how many projects are red, what the current forecast says.
An agent can start with a different question:
What deserves attention even though it has not become a headline problem yet?
Microsoft frames the new era of agentic AI in similar terms: answers alone rarely drive business impact — instead of simply delivering information, agents reason, act and collaborate inside workflows.
Microsoft Azure — Agent Factory: the new era of agentic AI →
That does not mean removing humans from project decisions. Quite the opposite.
Instead of reviewing 150 projects to discover three emerging problems, the system should surface the three projects where warning signals are starting to converge.
The value is helping humans focus their attention earlier.
What the Agents Actually Watch
This is exactly how Navorda AI divides the work. The Scout watches for schedule drift and emerging slippage. The Pathfinder connects risks to the milestones and dependencies they can affect. The Surveyor flags the silence — data going stale. The Quartermaster prices what the drift would cost.
Imagine the pattern they assemble:
- Environmental Permit: +42 days versus baseline.
- Risk mitigation: overdue.
- RtB: slipped in two previous reporting cycles.
- Project update: stale.
Individually, none is a prediction. Together, they form an early-warning pattern.
The useful output is not:
AI predicts COD will move by 64 days.
That would be false precision.
A better output is:
RtB exposure is increasing. The environmental permit remains unresolved, mitigation is overdue and the milestone has already drifted twice. Review this project.
That is explainable. And actionable.
The seven Navorda AI agents — how governed data becomes guided action →
Why a risk register must connect to milestones →
The Dashboard Is Still Necessary
This is not an argument against BI. Management needs portfolio KPIs. Boards need consistent reporting. Dashboards remain essential.
But dashboards and agents play different roles.
A dashboard says:
🔴 COD moved.
An agent should be able to say, earlier:
⚠️ These three things are increasing the likelihood that COD becomes the next problem.
One reports the outcome. The other connects the signals leading toward it. The combination is much more powerful.
The Real Test for Operational AI
Forget the chatbot for a moment. Ask your current operating model this question:
Which projects are becoming more exposed today, even though their main milestone has not yet turned red?
Could you answer it immediately? Could you explain why, signal by signal — each one connected to the relevant permit, risk, milestone, baseline and owner?
Or would someone need to open several spreadsheets, check the risk register, ask the country team and reconstruct the story?
That gap is where operational AI becomes valuable. The goal is not another dashboard. It is a portfolio that starts telling you where to look next.
Test that question against your own portfolio — take the five-minute Corporate Distance Assessment →